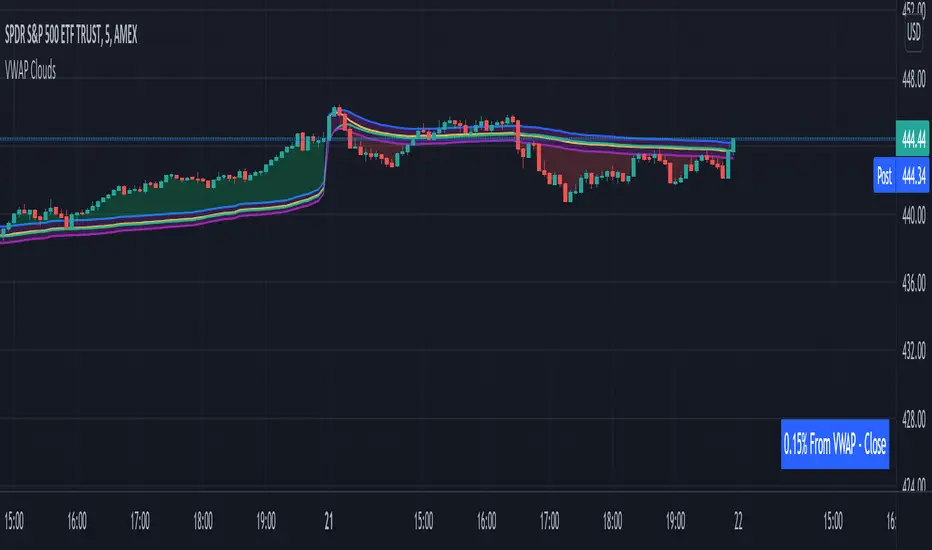
VWAP From Multiple Sources With Cloud & Percentage GapVWAP CLOUD FROM CLOSE, OPEN, HIGH & LOW SOURCES WITH CLOUD & PERCENTAGE GAP
VWAP stands for volume weighted average price and shows the average price of buys/sells based on volume traded across the current session. This VWAP is based off of the Daily session.
***HOW TO USE***
Use the purple cloud between the VWAPs as your entry points as price will typically bounce from that cloud area.
The Yellow Line is the VWAP using the close price as a source.
The Green Line is the VWAP using the open price as a source.
The Blue Line is the VWAP using the high price as a source.
The Purple Line is the VWAP using the low price as a source.
When price is above the VWAP cloud, the background will paint green because the trend is bullish.
When price is below the VWAP cloud, the background will paint red because the trend is bearish.
In the bottom right hand corner, three is a table that will show you the current percentage gap between current price and the VWAP using close as the source.
All sources and colors can be easily switched in the settings menu.
***MARKETS***
This indicator can be used as a signal on all markets, including stocks, crypto, futures and forex.
***TIMEFRAMES***
This vwap indicator can be used on all timeframes but is calculated using the daily session.
***TIPS***
Try using numerous indicators of ours on your chart so you can instantly see the bullish or bearish trend of multiple indicators in real time without having to analyze the data. Some of our favorites are our Auto Fibonacci, Volume Profile, Directional Movement Index, Momentum, Auto Support And Resistance and Money Flow Index in combination with this VWAP Cloud. The other indicators all have real time Bullish and Bearish labels as well so you can immediately understand each indicator's trend.
Cari skrip untuk "Buy sell"
Moon Phases Strategy [LuxAlgo]Trading moon phases has become quite popular among traders, believing that there exists a relationship between moon phases and market movements. This strategy is based on an estimate of moon phases with the possibility to use different methods to determine long/short positions based on moon phases.
Note that we assume moon phases are perfectly periodic with a cycle of 29.530588853 days (which is not realistically the case), as such there exists a difference between the detected moon phases by the strategy and the ones you would see. This difference becomes less important when using higher timeframes.
Settings
New Moon Reference Date: Date of a new moon to be used as starting point for the cycle calculation. Buy: Determine the condition to be used to open a long position Sell: Determine the condition to be used to open a short position
Description
The strategy can use different buy/sell conditions, these are determined in the Buy/Sell settings drop-down menu.
By default, the strategy goes long on a new moon and short on a full moon. This setup is common since full moons are said to be related to depressed mood. However, it is possible to use inverse conditions.
Users can also go long on higher moons (new moons or full moons occurring at a price that is higher than the previous one when a new/full moon occurred) and short on lower moons, this would return a trend following strategy, using the inverse conditions (buy lower moons/sell higher moons) would return a contrarian strategy.
The above chart displays the strategy using default conditions.
The above chart displays the strategy of going long on a higher moon and selling on a lower moon.
Quick Summary
We provide a quick summary of the strategy using default conditions (buy on a new moon, sell on a full moon) on various tickers using the 4h timeframe (note that using a lower timeframe would return a backtest executing a lower number of trades).
Constant position sizing is used and no frictional costs are considered.
BTCUSD
The moon phases strategy has been regularly tested with BTCUSD, with traders highlighting how moon phases tend to occur during tops/bottoms. We test the strategy from 2019-01-06 00:00.
Net Profit: $68544.86 Closed Trades : 67 % Profitability : 50.75 Max Drawdown : $18541.24 Max
TSLA
The strategy is tested from 2011-01-04 14:30
Net profit: $349.17 Closed Trades : 265 % Profitability : 54.34 Max Drawdown : $262.72
EURUSD
The strategy is tested from 2018-01-16 14:00.
Net profit: $-0.18 Closed Trades : 91 % Profitability : 50.55 Max Drawdown : 0.36

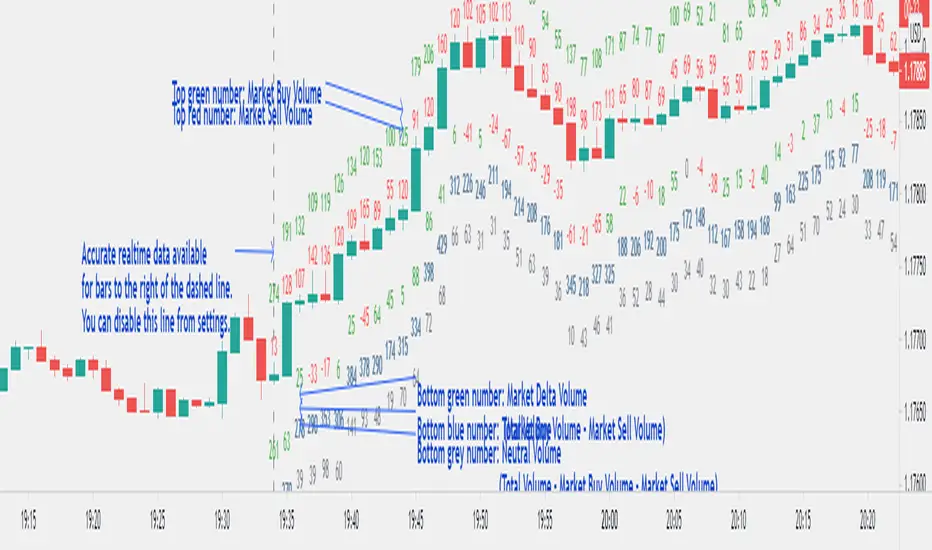
Market Delta Volume for Realtime BarsWhat is it?
Market Delta Volume Tool for real-time bars
A market delta tool that shows, (1) the volume that got transacted on upticks - or the market buy volume; (2) the volume that got transacted on downticks - or the market sell volume (3) the market delta volume (i.e., market buy volume - market sell volume); (4) the total volume (market buy volume + market sell volume + neutral volume); and (4) the volume that got transacted without a change in price - or the neutral volume (total volume = market buy volume + market sell volume + neutral volume)
NOTE: THIS WORKS ONLY ON REAL-TIME BARS, NOT ON HISTORICAL BARS! The dotted line marks the start of real-time data (i.e., the bar from which the indicator started collecting and displaying data). You will see accurate data only for bars to the right of this line.
The longer you keep a chart open with the study enabled, the more data it collects and displays and the better your analysis can potentially be.
Note that the data gets reset every time any of the options is changed, the market is switched, the browser is refreshed, or the script is reloaded.
DATA ISN'T STORED. I.e., every time a new symbol is loaded/or the same symbol is reloaded, data gets refreshed.
Who is it for?
For traders who are used to analyzing buy/sell activity using market delta information. Especially, short-term trader/scalpers who are used to keeping the same chart open through the trading session.
Also for traders to see and study how anomalies in volume can give clues to buyer/seller absorption, initiative buying/selling etc.
Can be used to better understand VSA as well, although not necessary.
Essentially, this gives real-time delta volume information; use it however you see fit.
CryptoSignalScanner - MACD Multiple Time FramesDESCRIPTION:
After receiving some multiple request to provide a MACD indicator that displays multiple timeframes at the same time I created this simple script.
You can use this script for free and adjust it as much you like.
With this script you can plot 6 MACD lines & 6 Signal lines.
• Current Timeframe MACD Line
• Current Timeframe Signal Line
• 15 minute candle MACD Line
• 15 minute candle Signal Line
• 30 minute candle MACD Line
• 30 minute candle Signal Line
• 1 hour candle MACD Line
• 1 hour candle Signal Line
• 2 hour candle MACD Line
• 2 hour candle Signal Line
• 4 hour candle MACD Line
• 4 hour candle Signal Line
HOW TO USE:
• When multiple MACD lines on an uptrend are grouped together it is time to SELL.
• When multiple MACD lines on a downtrend are grouped together it is time to BUY.
• The higher to length of the MACD lines the stronger the BUY/SELL signal.
FEATURES:
• You can show/hide the preferred MACD lines.
• You can show/hide the preferred Signal lines.
How MACD works
The MACD indicator is generated by subtracting two exponential moving averages (EMAs) to create the main line (MACD line), which is then used to calculate another EMA that represents the signal line. In addition, there is the MACD histogram, which is calculated based on the differences between those two lines. The histogram, along with the other two lines, fluctuates above and below a center line, which is also known as the zero line.
The MACD indicator consists of three elements moving around the zero line:
• The MACD line. By default the MACD line is calculated by subtracting the 26-day EMA from the 12-day EMA.
MACD line = 12d EMA - 26d EMA
• The signal line. By default the signal line is calculated from a 9-day EMA of the MACD line.
Signal line = 9d EMA of MACD line
• Histogram. The histogram is nothing more than a visual record of the relative movements of the MACD line and the signal line.
It is simply calculated as: MACD line - signal line
REMARKS:
• This advice is NOT financial advice.
• We do not provide personal investment advice and we are not a qualified licensed investment advisor.
• All information found here, including any ideas, opinions, views, predictions, forecasts, commentaries, suggestions, or stock picks, expressed or implied herein, are for informational, entertainment or educational purposes only and should not be construed as personal investment advice.
• We will not and cannot be held liable for any actions you take as a result of anything you read here.
• We only provide this information to help you make a better decision.
• While the information provided is believed to be accurate, it may include errors or inaccuracies.
Good Luck,
SEOCO

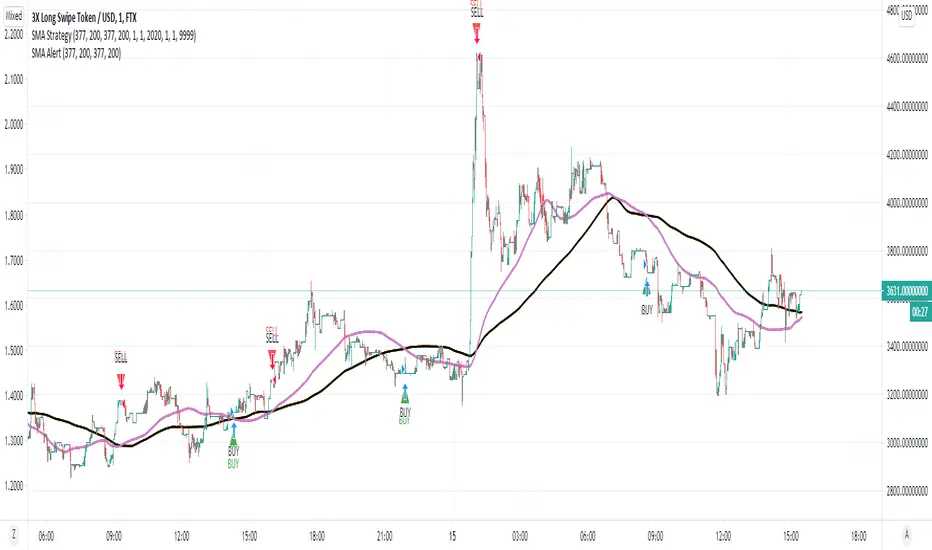
SMA Strategy - Indicator Version for AlertIn this indicator, I made use of two different sma intersections for buying and selling points. You can use the intersection of 2 sma values for buying and 2 separate sma intersection for selling.
There are 3 different alarms for those who want to set an alarm.
- Cross Alarm: The alarm that will work on buy-sell signals for those who have the right to set a single alarm.
- Buy Alarm: The alarm that will operate at the receiving point according to the values you specified.
- Sell Alarm: The alarm that will operate at the sales point according to the values you specify.
GnG - Cuan Sniper with 7MA and Buy Sell SignalThis Indicator possible users to get a signal when buying and selling.
Using Cross EMA :
when short EMA cross-up Long EMA is Signal to Buy
when short EMA cross-down Long EMA is Signal to Sell
Using Stochastic 14-3-3 to get signal overbought and oversold.
when oversold, and StochK is crossing-up stochD, will show signal to buy.
when overbought, and StockK is crossing-down stockD, will show signal to sell.
Using Parabolic SAR, Pivot H/L, Cloud and Linear Regression to find Resistance and Support.
Disclaimer On. Take your own risk.

FibMAThis study visually demonstrates Fibonacci moving averages.
The darker the color, the stronger the signal is for either buying or selling.
Buys/Sells only take place when each moving average is above/below the its adjactent fibonacci sequence, i.e 5<8<13<21<34<55<89<144 for buying..
Alerts are provided as BUY ASSET and SELL ASSET.
Multiple moving averages are also provided.

Sell / Buy RatesThis script finds sell / buy rates and adds its linear regression to the chart. its aim is finding buying and selling power, then you can try to find trend reversals. Also you can find divergences, it's very important signal for trend reversal.
Linear regression is a basic and commonly used type of predictive analysis.
if you choose lower periods then it will be more sensitive. I choose 34 as it's one of fibonnaci number.
If you find my works useful, please consider a donation
BTC: 16XRqyS3Vgh1knAU1tCcruqhUrVm4QWWmR

CryptogramTR with OPEN CODEIndicator is obtained by importing RSI(14) into HULL moving average source with 2 different periods, as one is long period and the other is short.
When green line (short period) cross upward the red line (long period) , this is a BUY; vice versa it is a SELL.
When HMA Short Period is set to 1 (one), yielding line is absolutely the same line of RSI (14). You can change it into 8(eight) preferably.
İndikatör, RSI(14) indikatörünün, hull hareketli ortalamasının kod kaynağı olarak atanması ile elde edilmiştir. Uzun ve kısa olmak üzere 2 ayrı periyot kullanılmıştır.
Yeşil çizgi yani kısa periyotlu çizgi, kırmızı yani uzun periyotlu olanı yukarı keserse AL, tersi durum SAT olarak düşünülmelidir.
Hull Kısa Periyodu 1 iken oluşan yeşil çizgi, RSI(14) indikatörünü vermektedir. Kısa periyot olarak tercihinize göre bu değeri 8 olarak da kullanabilirsiniz.

XPloRR MA-Trailing-Stop StrategyXPloRR MA-Trailing-Stop Strategy
Long term MA-Trailing-Stop strategy with Adjustable Signal Strength to beat Buy&Hold strategy
None of the strategies that I tested can beat the long term Buy&Hold strategy. That's the reason why I wrote this strategy.
Purpose: beat Buy&Hold strategy with around 10 trades. 100% capitalize sold trade into new trade.
My buy strategy is triggered by the fast buy EMA (blue) crossing over the slow buy SMA curve (orange) and the fast buy EMA has a certain up strength.
My sell strategy is triggered by either one of these conditions:
the EMA(6) of the close value is crossing under the trailing stop value (green) or
the fast sell EMA (navy) is crossing under the slow sell SMA curve (red) and the fast sell EMA has a certain down strength.
The trailing stop value (green) is set to a multiple of the ATR(15) value.
ATR(15) is the SMA(15) value of the difference between the high and low values.
The scripts shows a lot of graphical information:
The close value is shown in light-green. When the close value is lower then the buy value, the close value is shown in light-red. This way it is possible to evaluate the virtual losses during the trade.
the trailing stop value is shown in dark-green. When the sell value is lower then the buy value, the last color of the trade will be red (best viewed when zoomed)(in the example, there are 2 trades that end in gain and 2 in loss (red line at end))
the EMA and SMA values for both buy and sell signals are shown as a line
the buy and sell(close) signals are labeled in blue
How to use this strategy?
Every stock has it's own "DNA", so first thing to do is tune the right parameters to get the best strategy values voor EMA , SMA, Strength for both buy and sell and the Trailing Stop (#ATR).
Look in the strategy tester overview to optimize the values Percent Profitable and Net Profit (using the strategy settings icon, you can increase/decrease the parameters)
Then keep using these parameters for future buy/sell signals only for that particular stock.
Do the same for other stocks.
Important : optimizing these parameters is no guarantee for future winning trades!
Here are the parameters:
Fast EMA Buy: buy trigger when Fast EMA Buy crosses over the Slow SMA Buy value (use values between 10-20)
Slow SMA Buy: buy trigger when Fast EMA Buy crosses over the Slow SMA Buy value (use values between 30-100)
Minimum Buy Strength: minimum upward trend value of the Fast SMA Buy value (directional coefficient)(use values between 0-120)
Fast EMA Sell: sell trigger when Fast EMA Sell crosses under the Slow SMA Sell value (use values between 10-20)
Slow SMA Sell: sell trigger when Fast EMA Sell crosses under the Slow SMA Sell value (use values between 30-100)
Minimum Sell Strength: minimum downward trend value of the Fast SMA Sell value (directional coefficient)(use values between 0-120)
Trailing Stop (#ATR): the trailing stop value as a multiple of the ATR(15) value (use values between 2-20)
Example parameters for different stocks (Start capital: 1000, Order=100% of equity, Period 1/1/2005 to now) compared to the Buy&Hold Strategy(=do nothing):
BEKB(Bekaert): EMA-Buy=12, SMA-Buy=44, Strength-Buy=65, EMA-Sell=12, SMA-Sell=55, Strength-Sell=120, Stop#ATR=20
NetProfit: 996%, #Trades: 6, %Profitable: 83%, Buy&HoldProfit: 78%
BAR(Barco): EMA-Buy=16, SMA-Buy=80, Strength-Buy=44, EMA-Sell=12, SMA-Sell=45, Strength-Sell=82, Stop#ATR=9
NetProfit: 385%, #Trades: 7, %Profitable: 71%, Buy&HoldProfit: 55%
AAPL(Apple): EMA-Buy=12, SMA-Buy=45, Strength-Buy=40, EMA-Sell=19, SMA-Sell=45, Strength-Sell=106, Stop#ATR=8
NetProfit: 6900%, #Trades: 7, %Profitable: 71%, Buy&HoldProfit: 2938%
TNET(Telenet): EMA-Buy=12, SMA-Buy=45, Strength-Buy=27, EMA-Sell=19, SMA-Sell=45, Strength-Sell=70, Stop#ATR=14
NetProfit: 129%, #Trade

Real Relative Strength Breakout & BreakdownReal Relative Strength Breakout & Breakdown Indicator
What It Does
Identifies high-probability trading setups by combining:
Technical Breakouts/Breakdowns - Price breaking support/resistance zones
Real Relative Strength (RRS) - Volatility-adjusted performance vs benchmark (SPY)
Key Insight: The strongest signals occur when price action contradicts market direction—breakouts during market weakness or breakdowns during market strength show exceptional buying/selling pressure.
Real Relative Strength (RRS) Calculation
RRS measures outperformance/underperformance on a volatility-adjusted basis:
Power Index = (Benchmark Price Move) / (Benchmark ATR)
RRS = (Stock Price Move - Power Index × Stock ATR) / Stock ATR
RRS (smoothed) = 3-period SMA of RRS
Interpretation:
RRS > 0 = Relative Strength (outperforming)
RRS < 0 = Relative Weakness (underperforming)
Signal Types
🟢 Large Green Triangle (Premium Long)
Condition: Breakout + RRS > 0
Meaning: Stock breaking resistance WHILE outperforming benchmark
Best when: Market is weak but stock breaks out anyway = exceptional strength
Use: High-conviction long entries
🔵 Small Blue Triangle (Standard Breakout)
Condition: Breakout + RRS ≤ 0
Meaning: Breaking resistance but underperforming benchmark
Typical: "Rising tide lifts all boats" scenario during market rally
Use: Lower conviction—may just be following market
🟠 Large Orange Triangle (Premium Short)
Condition: Breakdown + RRS < 0
Meaning: Stock breaking support WHILE underperforming benchmark
Best when: Market is strong but stock breaks down anyway = severe weakness
Use: High-conviction short entries
🔴 Small Red Triangle (Standard Breakdown)
Condition: Breakdown + RRS ≥ 0
Meaning: Breaking support but outperforming benchmark
Typical: Stock falling less than market during selloff
Use: Lower conviction—may recover when market does
Why Large Triangles Matter
Large signals show divergence = genuine institutional flow:
Stock breaking out while market falls → Aggressive buying despite headwinds
Stock breaking down while market rallies → Aggressive selling despite tailwinds
These setups reveal where real conviction lies, not just momentum-following behavior.
Quick Settings
RRS: 12-period lookback, 3-bar smoothing, vs SPY
Breakouts: 5-period pivots, 200-bar lookback, 3% zone width, 2 minimum tests

Institutional Orderflow Pro — VWAP, Delta, and Liquidity
Institutional Orderflow Pro is a next-generation order flow analysis indicator designed to help traders identify institutional participation, directional bias, and exhaustion zones in real time.
Unlike traditional volume-based indicators, it merges VWAP dynamics, cumulative delta, relative volume, and liquidity proximity into a single unified dashboard that updates tick-by-tick — without repainting.
The indicator is open-source, transparent, and educational. It aims to provide traders with a clearer read on who controls the market — buyers or sellers — and where liquidity lies.
The indicator combines multiple institutional-grade analytics into one framework:
RVOL (Relative Volume) = Compares current volume against the average of recent bars to identify strong institutional participation.
zΔ (Delta Z-Score) = Normalizes the buying/selling delta to reveal unusually aggressive market behavior.
CVDΔ (Cumulative Volume Delta Change) = Shows which side (buyers/sellers) is dominating this bar’s order flow.
VWAP Direction & Slope = Determines whether price is trading above/below VWAP and whether VWAP is trending or flat.
PD Distance (Prev Day Confluence) = Measures the current price’s distance from previous day’s high, low, close, and VWAP in ATR units — highlighting liquidity zones.
ABS/EXH Detection = Identifies institutional absorption and exhaustion patterns where momentum may reverse.
Bias Computation = Combines VWAP direction + slope to give a simplified regime signal: UP, DOWN, or FLAT.
All metrics are displayed through a color-coded, non-repainting HUD:
🟢 = bullish / favorable conditions
🔴 = bearish / weak conditions
⚫ = neutral / flat
🟡 = absorption (potential trap zone)
🟠 = exhaustion (momentum fading)
| Metric | Signal | Meaning |
| ---------------------- | ------- | ---------------------------------------------- |
| **RVOL ≥ 1.3** | 🟢 | High institutional activity — valid setup zone |
| **zΔ ≥ 1.2 / ≤ -1.2** | 🟢 / 🔴 | Unusual buy/sell aggression |
| **CVDΔ > 0** | 🟢 | Buyers dominate this bar |
| **VWAP dir ↑ / ↓** | 🟢 / 🔴 | Institutional bias long/short |
| **Slope ok = YES** | 🟢 | Trending market |
| **PD dist ≤ 0.35 ATR** | 🟢 | Near key liquidity zones |
| **Bias = UP/DOWN** | 🟢 / 🔴 | Trend-aligned environment |
| **ABS/EXH active** | 🟡 / 🟠 | Caution — possible reversal zone |
How to Use
Confirm Volume Context → RVOL > 1.2
Align with Bias → Take longs only when Bias = UP, shorts only when Bias = DOWN.
Check Slope and VWAP Dir → Ensure trending context (Slope = YES).
Confirm CVD and zΔ → Flow should agree with price direction.
Avoid ABS/EXH Triggers → These signal exhaustion or absorption by large players.
Enter Near PD Zones → Ideal trade zones are within 0.35 ATR of prior-day levels.
This multi-factor confirmation reduces noise and focuses only on high-probability institutional setups.
Originality
This script was written from scratch in Pine v6.
It does not reuse existing public indicators except for standard built-ins (ta.vwap, ta.atr, etc.).
The unique combination of delta z-scoring, VWAP slope filtering, and real-time confluence zones distinguishes it from typical orderflow tools or cumulative delta overlays.
The core innovation is its merged real-time HUD that integrates institutional metrics and natural-language feedback directly on the chart, allowing traders to read market context intuitively rather than decode multiple subplots.
Notes & Disclaimers
This indicator does not repaint.
It’s intended for educational and analytical purposes only — not as financial advice or a guaranteed signal system.
Works best on liquid instruments (Futures, Indices, FX majors).
Avoid non-standard chart types (Heikin Ashi, Renko, etc.) for accurate readings.
Open-source, modifiable, and compatible with Pine v6.
Recommended Use
Apply it with clean charts and standard candles for the best clarity.
Use alongside a basic structure or volume profile to contextualize institutional bias zones.
Author: Dhawal Ranka
Category - Orderflow / VWAP / Institutional Analysis
Version: Pine Script™ v6
License: Open Source (Educational Use)

India VIX Based Nifty/BankNifty Range Calculator (Auto Fetch)VIX-Based Expected Daily Range (Auto Volatility Forecast)
Created by: Harshiv Symposium
📖 Purpose
This indicator automatically fetches the India VIX value and calculates the expected daily price range for major Indian indices such as Nifty and BankNifty.
It helps traders understand how much the market is likely to move today based on current volatility conditions.
Designed for educational and analytical awareness, not for signals or profit-making systems.
⚙️ Core Logic
Expected Daily Move (Range) = (India VIX × Current Index Price) ÷ Multiplier
- Multiplier for Nifty: 1000
- Multiplier for BankNifty: 700
This calculation projects the 1-standard-deviation (≈ 68% probability) and 2-standard-deviation (≈ 95% probability) movement zones for the day.
📊 Example
If India VIX = 15 and Nifty = 25,000:
Expected Move ≈ (15 × 25,000) ÷ 1000 = 375 points
Hence,
- 68% Range: 24,625 – 25,375
- 95% Range: 24,250 – 25,750
This gives traders a realistic idea of daily volatility boundaries.
🧭 Key Features
✅ Auto-Fetch India VIX
No need for manual input — automatically pulls live data from NSE:INDIAVIX.
✅ Dynamic Range Visualization
Plots upper/lower boundaries for 1σ and 2σ probability zones with shaded expected-move area.
✅ Dashboard Panel
Displays:
- Current VIX
- Expected Move (in points and %)
- Upper and Lower Ranges
✅ Smart Alerts
Alerts when price crosses upper or lower volatility range — potential breakout signal.
🎯 How It Helps
Intraday Traders:
Know the likely daily movement (e.g., ±220 pts on Nifty) and plan realistic targets or stops.
Options Traders:
Quickly assess whether it’s a seller-friendly (low VIX, small range) or buyer-friendly (high VIX, large range) session.
Risk Managers:
Use volatility context for stop-loss width and position sizing.
Breakout Traders:
If price breaks beyond the 2σ range → indicates potential volatility expansion.
💡 Interpretation Guide
Condition Market Behavior Strategy Insight
VIX ↓ ( < 14 ) Calm / Range-bound Option Selling Edge
VIX ↑ ( > 20 ) Volatile Sessions Option Buying Edge
Price within Range Stable Market Mean Reversion Setups
Price breaks Range Volatility Expansion Breakout Trades
⚠️ Disclaimer
This indicator is for educational and awareness purposes only.
It does not generate buy/sell signals or guarantee returns.
Always apply your own analysis and risk management.

Triple SuperTrend + RSI + Fib BB + Vol Osc Strategy✅ Key Features Implemented:
Three SuperTrend Indicators with different opacities:
ST1: 10 period, 1.0 multiplier (solid)
ST2: 11 period, 2.0 multiplier (40% transparent)
ST3: 12 period, 3.0 multiplier (70% transparent)
Signal Logic (no repainting):
BUY: All 3 SuperTrends turn green + RSI(7) > 50
SELL: All 3 SuperTrends turn red + RSI(7) < 50
EXIT: Any SuperTrend changes color OR price touches Fib BB
Fibonacci Bollinger Bands (200 SMA ± 2.618 × StdDev):
Purple bands with subtle fill
Gray dashed middle line
Visual Elements:
Green "BUY" labels below bars
Red "SELL" labels above bars
Yellow circle "EXIT" labels at candle tops
Green/red background tint when all STs align
Info dashboard showing real-time status
Alert Conditions for BUY, SELL, and EXIT
Position Tracking ensures only one signal per condition change
📊 Usage:
Copy the entire code and paste it into TradingView's Pine Editor, then click "Add to Chart". The indicator will display all three SuperTrends, Fibonacci Bollinger Bands, and generate signals according to your exact specifications.
The dashboard in the top-right corner shows the current status of each SuperTrend, RSI value, and whether you're in a position!RetryLH

Wyckoff Effort vs. Result📌 Wyckoff Effort vs. Result (E/R) – Visualizing Supply & Demand Imbalance with Volume Confirmation
📖 Overview
The Wyckoff Effort vs. Result (E/R) indicator is designed to help traders interpret market behavior through the lens of volume vs. price movement — a foundational concept in Richard Wyckoff’s methodology.
This tool aims to highlight moments where the “effort” (volume) is not in proportion to the “result” (price movement) — giving insight into potential accumulation or distribution events.
By detecting high-volume candles and classifying them based on their price direction, the indicator visualizes zones where smart money might be active .
⚙️ How It Works
1. Effort Accumulation (High Volume Down Bar):
• When a candle closes lower than it opens (down bar) and has above-average volume , it’s marked as potential absorption of selling pressure (effort to push down met by buying).
• These candles are colored red and the open level is plotted, acting as a potential support or re-test zone.
2. Effort Distribution (High Volume Up Bar):
• When a candle closes higher than it opens (up bar) and has above-average volume , it’s marked as potential distribution (effort to push up absorbed by sellers).
• These candles are colored green and the open level is plotted , acting as a potential resistance or rejection zone.
3. Average Volume Calculation:
• The script calculates a simple moving average (SMA) of volume over a user-defined lookback period.
• If current volume exceeds the average multiplied by a set threshold, it’s treated as a high-effort bar .
🧪 Inputs
Input Description
Average Volume Lookback - Number of bars used to calculate the volume average
High Volume Multiplier. - Multiplier to define what qualifies as “high volume”
🖥️ Visual Output
• 🔴 Red candles = High volume on a down bar → possible accumulation
• 🟢 Green candles = High volume on an up bar → possible distribution
• 📉 Horizontal lines at bar open price mark the potential zones where effort occurred
These zones can serve as:
• Areas of support/resistance
• Trap zones where smart money absorbs liquidity
• Entry/exit filters when combined with price action
🧠 How to Use
• Use in combination with price structure, support/resistance, and volume profile tools
• Watch how price reacts when it revisits the plotted lines
• Look for effort bars that fail to lead to continuation, signaling potential reversal
• Can be used in scalping, swing trading, or Wyckoff-style phase analysis
🔒 Technical Notes
• ✅ Does not repaint
• ✅ Built with Pine Script v6
• ✅ Lightweight and customizable
• ❌ Does not generate buy/sell signals — it provides context, not predictions

EMA Trend Buy sell strategyThis strategy is built to help investors get into a trend safely and smartly — without rushing and without getting in and out too often.
When to Buy:
First Signal – Small Step In (50% Buy)
When the short-term trend (EMA 18) turns positive and goes above the medium trend (EMA 33),
👉 we buy half of our planned position.
This is an early warning that a new upward trend might be starting.
Second Signal – Full Confidence (Buy other 50%)
If the medium-term trend (EMA 33) also crosses above the long-term (EMA 50),
👉 we buy the other half of the position.
Now we’re more confident that the trend is real.
When to Sell:
First Warning – Reduce Position (Sell 50%)
If EMA 33 falls below EMA 50,
👉 we sell half of the position to reduce risk.
Trend Reversal – Exit Completely (Sell the rest)
If EMA 18 also falls below EMA 33,
👉 we sell the remaining half and leave the trade fully.
Why This Strategy?
📉 We don’t jump in all at once.
→ We wait for confirmation before going full in.
⏳ We stay in the trade as long as the trend is healthy.
→ No overtrading or reacting to small moves.
📊 We get out slowly, not suddenly.
→ This helps protect profits and avoid emotional decisions.

CVD Pro – Smart Overlay + Signals (with Persist Mode)What this Indicator Does
CVD Pro visualizes Cumulative Volume Delta (CVD) data directly on your main price chart — helping you detect real buying vs. selling pressure in real time.
Unlike most CVD scripts that run in a separate subwindow, this one overlays price-mapped CVD curves on the candles themselves for better confluence with market structure and FVG zones.
The script dynamically scales normalized CVD values to the price range and uses adaptive smoothing and deviation bands to highlight shifts in trader behavior.
It also includes automatic bullish/bearish crossover signals, displayed as on-chart labels.
⚙️ Main Features
✅ Price-mapped CVD Overlay
CVD is normalized (Z-score) and projected onto the price chart for easy visual correlation with price structure.
✅ Multi-Timeframe Presets
Three sensitivity presets optimized for different chart environments:
Strict (4H) → Best for macro trends and high-timeframe structure.
Balanced (1H / 30m) → Great for active swing setups.
Sensitive (15m) → Captures short-term intraday reversals.
✅ Dynamic Bands & Smoothing
Deviation bands visualize statistical extremes in delta pressure — helping to identify exhaustion and divergence points.
✅ Smart Buy/Sell Signal Logic
Automatic label triggers when the CVD Overlay crosses its smoothed baseline:
🟢 BULL LONG → Rising CVD above the mean (buyers in control).
🔴 BEAR SHORT → Falling CVD below the mean (sellers in control).
✅ Persist Mode
Toggle to keep the last signal visible until a new one forms — ideal for traders who prefer clean chart annotations without noise.
✅ Clean, Minimal Overlay
Everything happens directly on your chart — no extra windows, no clutter. Designed for use with Smart Money Concepts, Fair Value Gaps (FVGs), or volume imbalance setups.
🧩 Use Case
CVD Pro is designed for traders who:
Use Smart Money Concepts (SMC) or ICT-style trading
Watch for FVG reactions, breaker blocks, and liquidity sweeps
Need to confirm order flow direction or momentum strength
Trade intraday or swing setups with precision entries and clear bias confirmation
⚡ Recommended Settings
4H / 1H: Use Strict mode for major structure and confirmation.
1H / 30m: Balanced mode for clear mid-term trend alignment.
15m: Sensitive mode to catch scalps and lower-TF shifts.
🧠 Pro Tips
Combine with RSI or Market Structure Breaks (MSS) for additional confluence.
A strong CVD divergence near a key FVG or 0.5–0.705 Fibonacci zone often signals reversal.
Persistent CVD crossover + price structure break = high-probability entry.
🧩 Credits
Created by Patrick S. ("Nova Labs")
Concept inspired by professional order-flow analytics and adaptive Z-Score normalization.
Would you like me to write a shorter “public summary” paragraph (for the short description at the top of TradingView, the one-liner users see before expanding)?
It’s usually a 2–3 sentence hook like:
“Overlay-based CVD indicator that merges volume delta with price structure. Detect true buying/selling pressure using adaptive normalization, deviation bands, and clean bullish/bearish crossover signals.”

Adaptive HMA SignalsAdaptive HMA Signals
This indicator pairs nicely with the Contrarian 100 MA and can be located here:
Overview
The "Adaptive HMA Signals" indicator is a sophisticated technical analysis tool designed for traders aiming to capture trend changes with precision. By leveraging Hull Moving Averages (HMAs) that adapt dynamically to market conditions (volatility or volume), this indicator generates actionable buy and sell signals based on price interactions with adaptive HMAs and slope analysis. Optimized for daily charts, it is highly customizable and suitable for trading forex, stocks, cryptocurrencies, or other assets. The indicator is ideal for swing traders and trend followers seeking to time entries and exits effectively.
How It Works
The indicator uses two adaptive HMAs—a primary HMA and a minor HMA—whose periods adjust dynamically based on user-selected market conditions (volatility via ATR or volume via RSI). It calculates the slope of the primary HMA to identify trend strength and generates exit signals when the price crosses the minor HMA under specific slope conditions. Signals are plotted as circles above or below the price, with inverted colors (white for buy, blue for sell) to enhance visibility on any chart background.
Key Components
Adaptive HMAs: Two HMAs (primary and minor) with dynamic periods that adjust based on volatility (ATR-based) or volume (RSI-based) conditions. Periods range between user-defined minimum and maximum values, adapting by a fixed percentage (3.141%).
Slope Analysis: Calculates the slope of the primary HMA over a 34-bar period to gauge trend direction and strength, normalized using market range data.
Signal Logic: Generates buy signals (white circles) when the price falls below the minor HMA with a flat or declining slope (indicating a potential trend reversal) and sell signals (blue circles) when the price rises above the minor HMA with a flat or rising slope.
Signal Visualization: Plots signals at an offset based on ATR for clarity, using semi-transparent colors to avoid chart clutter.
Mathematical Concepts
Dynamic Period Adjustment:
Primary HMA period adjusts between minLength (default: 144) and maxLength (default: 200).
Minor HMA period adjusts between minorMin (default: 55) and minorMax (default: 89).
Periods decrease by 3.141% under high volatility/volume and increase otherwise.
HMA Calculation:
Uses the Hull Moving Average formula: WMA(2 * WMA(src, length/2) - WMA(src, length), sqrt(length)).
Provides a smoother, faster-responding moving average compared to traditional MAs.
Slope Calculation:
Computes the slope of the primary HMA using a 34-bar period, normalized by the market range (highest high - lowest low over 34 bars).
Slope angle is converted to degrees using arccosine for intuitive trend strength interpretation.
Signal Conditions:
Buy: Slope ≥ 17° (flat or rising), price < minor HMA, low volatility/volume.
Sell: Slope ≤ -17° (flat or declining), price > minor HMA, low volatility/volume.
Signals are triggered only on confirmed bars to avoid repainting.
Entry and Exit Rules
Buy Signal (White Circle): Triggered when the price crosses below the minor HMA, the slope of the primary HMA is flat or rising (≥17°), and volatility/volume is low. The signal appears as a white circle above the price bar, offset by 0.72 * ATR(5).
Sell Signal (Blue Circle): Triggered when the price crosses above the minor HMA, the slope of the primary HMA is flat or declining (≤-17°), and volatility/volume is low. The signal appears as a blue circle below the price bar, offset by 0.72 * ATR(5).
Exit Rules: Exit a buy position on a sell signal and vice versa. Combine with other tools (e.g., support/resistance, RSI) for additional confirmation. Always apply proper risk management.
Recommended Usage
The "Adaptive HMA Signals" indicator is optimized for daily charts but can be adapted to other timeframes (e.g., 1H, 4H) with adjustments to period lengths. It performs best in trending or range-bound markets with clear reversal points. Traders should:
Backtest the indicator on their chosen asset and timeframe to validate signal reliability.
Combine with other technical tools (e.g., trendlines, Fibonacci retracements) for stronger trade setups.
Adjust minLength, maxLength, minorMin, and minorMax based on market volatility and timeframe.
Use the Charger input to toggle between volatility (ATR) and volume (RSI) adaptation for optimal performance in specific market conditions.
Customization Options
Source: Choose the price source (default: close).
Show Signals: Toggle visibility of buy/sell signals (default: true).
Charger: Select adaptation trigger—Volatility (ATR-based) or Volume (RSI-based) (default: Volatility).
Main HMA Periods: Set minimum (default: 144) and maximum (default: 200) periods for the primary HMA.
Minor HMA Periods: Set minimum (default: 55) and maximum (default: 89) periods for the minor HMA.
Slope Period: Fixed at 34 bars for slope calculation, adjustable via code if needed.
Why Use This Indicator?
The "Adaptive HMA Signals" indicator combines the responsiveness of HMAs with dynamic adaptation to market conditions, offering a robust tool for identifying trend reversals. Its clear visual signals, customizable periods, and adaptive logic make it versatile for various markets and trading styles. Whether you’re a beginner or an experienced trader, this indicator enhances your ability to time entries and exits with precision.
Tips for Users
Test the indicator thoroughly on your chosen market and timeframe to optimize settings (e.g., adjust period lengths for non-daily charts).
Use in conjunction with price action or other indicators (e.g., RSI, MACD) for stronger trade confirmation.
Monitor volatility/volume conditions to ensure the Charger setting aligns with market dynamics.
Ensure your chart timeframe aligns with the selected period lengths for accurate signal generation.
Apply strict risk management to protect against false signals in choppy markets.
Happy trading with the Adaptive HMA Signals indicator! Share your feedback and strategies in the TradingView community!

Liquidity Pro Map [ChartPrime]⯁ OVERVIEW
Liquidity Pro Map is a market-structure tool that simulates liquidity distribution by splitting price history into buy-side and sell-side profiles. Using candle volume and the standard deviation of close, the indicator builds two mirrored volume maps on the right-hand side of the chart. It also extends liquidity levels backwards in time until they are crossed by price, allowing you to see which zones remain untouched and where liquidity is most likely resting. Cumulative skew lines and highlighted POC levels give additional clarity on imbalance between buyers and sellers.
⯁ KEY FEATURES
Dual Liquidity Profiles: The chart is divided into buy-side (green) and sell-side (red) liquidity profiles, letting you instantly compare both sides of order flow.
Level Extension Logic: Each liquidity level is extended back in time until price crosses it. If not crossed, it persists all the way to the indicator’s lookback period, marking zones that remain “untapped.”
Dynamic Binning with Standard Deviation: The indicator distributes candle volumes into bins using close-price deviation, creating a more realistic liquidity map than static price levels.
priceDeviation = ta.stdev(close, 25) * 2
priceReference = close > open ? low - priceDeviation : high + priceDeviation
Cumulative Volume Skew Lines: Polylines on the right-hand side show the aggregated buy and sell volume profiles, making it easy to spot imbalance.
POC Identification: Highest-volume levels on both sides are marked as POC (Point of Control) , providing key zones of interest.
Clear Color Coding: Gradient shading intensifies with volume concentration—dark teal/green for buy zones, dark pink/red for sell zones.
⯁ HOW IT WORKS (UNDER THE HOOD)
Volume Distribution: Each bar’s volume is assigned to a price bin based on its reference price (close ± standard deviation offset).
Buy vs. Sell Splitting: If bins above last close price, volume is allocated to sell-side liquidity; otherwise, it’s allocated to buy-side liquidity.
Level Extension: Boxes marking liquidity bins extend back until crossed by price. If uncrossed, they anchor all the way to the start of the lookback window.
Cumulative Polylines: As bins are stacked, cumulative buy and sell values form skew polylines plotted at the right edge.
POC Levels: The highest-volume bin on each side is highlighted with labels and arrows, marking where the heaviest liquidity is concentrated.
⯁ USAGE
Use buy/sell profiles to see where liquidity is likely resting. Green shelves suggest potential support zones; red shelves suggest resistance or sell liquidity pools.
Watch untouched extended levels —these often become magnets for price as liquidity is swept.
Track POC levels as primary liquidity targets, where reactions or fakeouts are most common.
Compare cumulative skew lines to judge which side dominates in volume. Heavy buy skew may indicate absorption of sell pressure, and vice versa.
Adjust lookback period to switch between intraday liquidity maps and larger swing-based profiles.
Use separator feature to hide bins borders for better visual clarity.
Use as a confluence tool with OBs, support/resistance, and liquidity sweep setups.
⯁ CONCLUSION
Liquidity Pro Map transforms candle volume into a structured simulation of where liquidity may rest across the chart. By dividing buy vs. sell profiles, extending untouched levels, and marking cumulative skew and POC, it equips traders with a clear visual map of potential liquidity pools. This allows for better anticipation of sweeps, reversals, and areas of high market activity.

Volume Delta Oscillator with Divergence█ OVERVIEW
The Volume Delta Oscillator with Divergence is a technical indicator designed for the TradingView platform, helping traders identify potential trend reversal points and market momentum shifts through volume delta analysis and divergence detection. The indicator combines a smoothed volume delta oscillator with moving average-based signals, overbought/oversold levels, and divergence visualization, enhanced by configurable gradients and alerts for quick decision-making.
█ CONCEPT
The core idea of the indicator is to measure net buying or selling pressure through volume delta, smooth it for greater clarity, and detect divergences between price action and the oscillator. The indicator does not use external data, making it a compromise but practical tool for analyzing market dynamics based on available price and volume data. It provides insights into market dynamics, overbought/oversold conditions, and potential reversal points, with an attractive visual presentation.
█ WHY USE IT?
- Divergence detection: Identifies bullish and bearish divergences between price and the oscillator, signaling potential reversals.
- Volume delta analysis: Measures cumulative volume delta to assess buying/selling pressure, expressed as a percentage for cross-market comparability.
- Signal generation: Creates buy/sell signals based on overbought/oversold level crossovers, zero line crossovers, and moving average zero line crossovers.
- Visual clarity: Uses gradients, fills, and dynamic colors for intuitive chart analysis.
- Flexibility: Numerous settings allow adaptation to various markets (e.g., forex, crypto, stocks) and trading strategies.
█ HOW IT WORKS?
- Volume delta calculation: Computes net buying/selling pressure per candle as volume * (close - open) / (high - low), aggregated over a specified period (Cumulative Delta Length).
- Smoothing: Applies an EMA (Smoothing Length) to the cumulative delta percentage, creating a smoother oscillator (Delta Oscillator).
- Moving Average: Calculates an SMA (Moving Average Length) of the smoothed delta for trend confirmation (Moving Average (SMA)).
- Divergence detection: Identifies bullish and bearish divergences by comparing price and oscillator pivot highs/lows within a specified range (Pivot Length).
- Normalization: Delta is expressed as a percentage of total volume, ensuring consistency across instruments and timeframes.
- Signals: Generates signals for:
Crossing the oversold level upward (buy) or overbought level downward (sell).
Crossing the zero line by the oscillator or moving average (buy/sell).
Bullish/bearish divergences, marked with labels.
- Visualization: Draws the oscillator and moving average with dynamic colors, gradient fills, and transparent bands and labels, with configurable overbought/oversold levels.
- Alerts: Built-in alerts for divergence detection, overbought/oversold crossovers, and zero line crossovers (both oscillator and moving average).
█ SETTINGS AND CUSTOMIZATION
- Cumulative Delta Length: Period for aggregating volume delta (default: 14).
- Smoothing Length (EMA): EMA length for smoothing the delta oscillator (default: 2). Higher values smooth the signal but reduce the number of generated signals.
- Moving Average Length (SMA): SMA length for the moving average line (default: 40). Higher values allow SMA to be analyzed as a trend indicator, but require adjusting overbought/oversold levels for MA, as longer MA oscillates less.
- Pivot Length (Left/Right): Number of candles for detecting pivot highs/lows in divergence calculations (default: 2). Higher values can reduce noise but introduce a delay equal to the set value.
- Overbought/Oversold Levels: Thresholds for the oscillator (default: 18/-18) and for the moving average (default: 10/-10). For the moving average, no arrows appear; instead, the band changes color from gray to green (oversold) or red (overbought), which can strengthen entry signals for delta.
- Signal Type: Select signals to display: "Overbought/Oversold", "Zero Line", "MA Zero Line", "All", or "None" (default: Overbought/Oversold).
- Colors and gradients: Customize colors for bullish/bearish oscillator, moving average, zero line, overbought/oversold levels, and divergence labels.
- Transparency: Adjust gradient fill transparency (default: 70) and band/label transparency (default: 40) for consistent appearance.
- Visualizations: Enable/disable the moving average, gradients for zero/overbought/oversold levels, and gradient fills.
█ USAGE EXAMPLES
- Momentum analysis: Observe the delta oscillator above 0 for bullish momentum or below 0 for bearish momentum. The moving average (SMA), being smoothed, reacts more slowly and can confirm trend direction as a noise filter.
- Reversal signals: Look for buy triangles when the oscillator crosses the oversold level upward, especially when the moving average is below the MA oversold threshold. Similarly, look for sell triangles when crossing the overbought level downward, with the moving average above the MA overbought threshold. Divergence labels (bullish/bearish) indicate potential reversals.
- Divergence trading: Use bullish divergence labels (green) for potential buy opportunities and bearish labels (red) for sell opportunities, especially when confirmed by price action or other indicators.
- Customization: Adjust the cumulative delta length, smoothing, and moving average length to specific instruments and timeframes to minimize false signals.
█ NOTES FOR USERS
- Combine the indicator with other tools, such as Fibonacci levels, RSI, or pivot points, to increase accuracy.
- Test different settings for cumulative delta length, smoothing, and moving average length on your chosen instrument and timeframe to find optimal values.

BTCUSD Dual Thrust (1H)BTCUSD Dual Thrust (1H) — Indicator
Overview
The Dual Thrust is a classic breakout-type strategy designed to capture strong directional moves when markets show imbalance between buyers and sellers. This indicator adapts the method specifically for BTCUSD on the 1-Hour timeframe, showing dynamic Buy/Sell trigger levels and live signals.
Origin
The Dual Thrust system was originally introduced by Michael Vitucci and has been widely used in futures and high-volatility markets. It was designed as a day-trading breakout framework, where daily high/low and close data define the range for the next session’s trade triggers.
How it Works
Each new day, the indicator calculates a “breakout range” using daily price data.
Two trigger levels are projected from the daily open:
Buy Trigger: Open + Range × KUp
Sell Trigger: Open - Range × KDn
Range can be built from either:
Classic Dual Thrust formula: max(High - Close , Close - Low) over a lookback period, or
ATR-based range: for volatility-adaptive signals.
A LONG signal fires when price crosses above the Buy Trigger.
An EXIT signal fires when price crosses below the Sell Trigger.
Buy/Sell lines step forward across each intraday bar until recalculated at the next daily open.
Practical Use
Optimized for BTCUSD 1-Hour charts (crypto’s volatility provides stronger follow-through).
Use the Buy/Sell levels as dynamic breakout lines or as confluence with your own setups.
Alerts are built in, so you can receive notifications when a LONG or EXIT condition triggers.
Designed as an indicator only (not a backtest strategy).
Key Features
✅ Daily Buy/Sell trigger lines auto-calculated and forward-filled
✅ LONG / EXIT labels on signals
✅ Optional ATR mode for volatility regimes
✅ Optional bar coloring for easy visual scanning
✅ Alerts ready for live monitoring
⚡️ Tip: While this indicator highlights breakout opportunities, effectiveness can improve when combined with trend filters (e.g., 200-SMA) or when aligned with higher timeframe supply/demand zones.

Live Market - Performance MonitorLive Market — Performance Monitor
Study material (no code) — step-by-step training guide for learners
________________________________________
1) What this tool is — short overview
This indicator is a live market performance monitor designed for learning. It scans price, volume and volatility, detects order blocks and trendline events, applies filters (volume & ATR), generates trade signals (BUY/SELL), creates simple TP/SL trade management, and renders a compact dashboard summarizing market state, risk and performance metrics.
Use it to learn how multi-factor signals are constructed, how Greeks-style sensitivity is replaced by volatility/ATR reasoning, and how a live dashboard helps monitor trade quality.
________________________________________
2) Quick start — how a learner uses it (step-by-step)
1. Add the indicator to a chart (any ticker / timeframe).
2. Open inputs and review the main groups: Order Block, Trendline, Signal Filters, Display.
3. Start with defaults (OB periods ≈ 7, ATR multiplier 0.5, volume threshold 1.2) and observe the dashboard on the last bar.
4. Walk the chart back in time (use the last-bar update behavior) and watch how signals, order blocks, trendlines, and the performance counters change.
5. Run the hands-on labs below to build intuition.
________________________________________
3) Main configurable inputs (what you can tweak)
• Order Block Relevant Periods (default ~7): number of consecutive candles used to define an order block.
• Min. Percent Move for Valid OB (threshold): minimum percent move required for a valid order block.
• Number of OB Channels: how many past order block lines to keep visible.
• Trendline Period (tl_period): pivot lookback for detecting highs/lows used to draw trendlines.
• Use Wicks for Trendlines: whether pivot uses wicks or body.
• Extension Bars: how far trendlines are projected forward.
• Use Volume Filter + Volume Threshold Multiplier (e.g., 1.2): requires volume to be greater than multiplier × average volume.
• Use ATR Filter + ATR Multiplier: require bar range > ATR × multiplier to filter noise.
• Show Targets / Table settings / Colors for visualization.
________________________________________
4) Core building blocks — what the script computes (plain language)
Price & trend:
• Spot / LTP: current close price.
• EMA 9 / 21 / 50: fast, medium, slow moving averages to define short/medium trend.
o trend_bullish: EMA9 > EMA21 > EMA50
o trend_bearish: EMA9 < EMA21 < EMA50
o trend_neutral: otherwise
Volatility & noise:
• ATR (14): average true range used for dynamic target and filter sizing.
• dynamic_zone = ATR × atr_multiplier: minimum bar range required for meaningful move.
• Annualized volatility: stdev of price changes × sqrt(252) × 100 — used to classify volatility (HIGH/MEDIUM/LOW).
Momentum & oscillators:
• RSI 14: overbought/oversold indicator (thresholds 70/30).
• MACD: EMA(12)-EMA(26) and a 9-period signal line; histogram used for momentum direction and strength.
• Momentum (ta.mom 10): raw momentum over 10 bars.
Mean reversion / band context:
• Bollinger Bands (20, 2σ): upper, mid, lower.
o price_position measures where price sits inside the band range as 0–100.
Volume metrics:
• avg_volume = SMA(volume, 20) and volume_spike = volume > avg_volume × volume_threshold
o volume_ratio = volume / avg_volume
Support & Resistance:
• support_level = lowest low over 20 bars
• resistance_level = highest high over 20 bars
• current_position = percent of price between support & resistance (0–100)
________________________________________
5) Order Block detection — concept & logic
What it tries to find: a bar (the base) followed by N candles in the opposite direction (a classical order block setup), with a minimum % move to qualify. The script records the high/low of the base candle, averages them, and plots those levels as OB channels.
How learners should think about it (conceptual):
1. An order block is a signature area where institutions (theory) left liquidity — often seen as a large bar followed by a sequence of directional candles.
2. This indicator uses a configurable number of subsequent candles to confirm that the pattern exists.
3. When found, it stores and displays the base candle’s high/low area so students can see how price later reacts to those zones.
Implementation note for learners: the tool keeps a limited history of OB lines (ob_channels). When new OBs exceed the count, the oldest lines are removed — good practice to avoid clutter.
________________________________________
6) Trendline detection — idea & interpretation
• The script finds pivot highs and lows using a symmetric lookback (tl_period and half that as right/left).
• It then computes a trendline slope from successive pivots and projects the line forward (extension_bars).
• Break detection: Resistance break = close crosses above the projected resistance line; Support break = close crosses below projected support.
Learning tip: trendlines here are computed from pivot points and time. Watch how changing tl_period (bigger = smoother, fewer pivots) alters the trendlines and break signals.
________________________________________
7) Signal generation & filters — step-by-step
1. Primary triggers:
o Bullish trigger: order block bullish OR resistance trendline break.
o Bearish trigger: bearish order block OR support trendline break.
2. Filters applied (both must pass unless disabled):
o Volume filter: volume must be > avg_volume × volume_threshold.
o ATR filter: bar range (high-low) must exceed ATR × atr_multiplier.
o Not in an existing trade: new trades only start if trade_active is false.
3. Trend confirmation:
o The primary trigger is only confirmed if trend is bullish/neutral for buys or bearish/neutral for sells (EMA alignment).
4. Result:
o When confirmed, a long or short trade is activated with TP/SL calculated from ATR multiples.
________________________________________
8) Trade management — what the tool does after a signal
• Entry management: the script marks a trade as trade_active and sets long_trade or short_trade flags.
• TP & SL rules:
o Long: TP = high + 2×ATR ; SL = low − 1×ATR
o Short: TP = low − 2×ATR ; SL = high + 1×ATR
• Monitoring & exit:
o A trade closes when price reaches TP or SL.
o When TP/SL hit, the indicator updates win_count and total_pnl using a very simple calculation (difference between TP/SL and previous close).
o Visual lines/labels are drawn for TP and updated as the trade runs.
Important learner notes:
• The script does not store a true entry price (it uses close in its P&L math), so PnL is an approximation — treat this as a learning proxy, not a position accounting system.
• There’s no sizing, slippage, or fee accounted — students must manually factor these when translating to real trades.
• This indicator is not a backtesting strategy; strategy.* functions would be needed for rigorous backtest results.
________________________________________
9) Signal strength & helper utilities
• Signal strength is a composite score (0–100) made up of four signals worth 25 points each:
1. RSI extreme (overbought/oversold) → 25
2. Volume spike → 25
3. MACD histogram magnitude increasing → 25
4. Trend existence (bull or bear) → 25
• Progress bars (text glyphs) are used to visually show RSI and signal strength on the table.
Learning point: composite scoring is a way to combine orthogonal signals — study how changing weights changes outcomes.
________________________________________
10) Dashboard — how to read each section (walkthrough)
The dashboard is split into sections; here's how to interpret them:
1. Market Overview
o LTP / Change%: immediate price & daily % change.
2. RSI & MACD
o RSI value plus progress bar (overbought 70 / oversold 30).
o MACD histogram sign indicates bullish/bearish momentum.
3. Volume Analysis
o Volume ratio (current / average) and whether there’s a spike.
4. Order Block Status
o Buy OB / Sell OB: the average base price of detected order blocks or “No Signal.”
5. Signal Status
o 🔼 BUY or 🔽 SELL if confirmed, or ⚪ WAIT.
o No-trade vs Active indicator summarizing market readiness.
6. Trend Analysis
o Trend direction (from EMAs), market sentiment score (composite), volatility level and band/position metrics.
7. Performance
o Win Rate = wins / signals (percentage)
o Total PnL = cumulative PnL (approximate)
o Bull / Bear Volume = accumulated volumes attributable to signals
8. Support & Resistance
o 20-bar highest/lowest — use as nearby reference points.
9. Risk & R:R
o Risk Level from ATR/price as a percent.
o R:R Ratio computed from TP/SL if a trade is active.
10. Signal Strength & Active Trade Status
• Numeric strength + progress bar and whether a trade is currently active with TP/SL display.
________________________________________
11) Alerts — what will notify you
The indicator includes pre-built alert triggers for:
• Bullish confirmed signal
• Bearish confirmed signal
• TP hit (long/short)
• SL hit (long/short)
• No-trade zone
• High signal strength (score > 75%)
Training use: enable alerts during a replay session to be notified when the indicator would have signalled.
________________________________________
12) Labs — hands-on exercises for learners (step-by-step)
Lab A — Order Block recognition
1. Pick a 15–30 minute timeframe on a liquid ticker.
2. Use default OB periods (7). Mark each time the dashboard shows a Buy/Sell OB.
3. Manually inspect the chart at the base candle and the following sequence — draw the OB zone by hand and watch later price reactions to it.
4. Repeat with OB periods 5 and 10; note stability vs noise.
Lab B — Trendline break confirmation
1. Increase trendline period (e.g., 20), watch trendlines form from pivots.
2. When a resistance break is flagged, compare with MACD & volume: was momentum aligned?
3. Note false breaks vs confirmed moves — change extension_bars to see projection effects.
Lab C — Filter sensitivity
1. Toggle Use Volume Filter off, and record the number and quality of signals in a 2-day window.
2. Re-enable volume filter and change threshold from 1.2 → 1.6; note how many low-quality signals are filtered out.
Lab D — Trade management simulation
1. For each signalled trade, record the time, close entry approximation, TP, SL, and eventual hit/miss.
2. Compute actual PnL if you had entered at the open of the next bar to compare with the script’s PnL math.
3. Tabulate win rate and average R:R.
Lab E — Performance review & improvement
1. Build a spreadsheet of signals over 30–90 periods with columns: Date, Signal type, Entry price (real), TP, SL, Exit, PnL, Notes.
2. Analyze which filters or indicators contributed most to winners vs losers and adjust weights.
________________________________________
13) Common pitfalls, assumptions & implementation notes (things to watch)
• P&L simplification: total_pnl uses close as a proxy entry price. Real entry/exit prices and slippage are not recorded — so PnL is approximate.
• No position sizing or money management: the script doesn’t compute position size from equity or risk percent.
• Signal confirmation logic: composite "signal_strength" is a simple 4×25 point scheme — explore different weights or additional signals.
• Order block detection nuance: the script defines the base candle and checks the subsequent sequence. Be sure to verify whether the intended candle direction (base being bullish vs bearish) aligns with academic/your trading definition — read the code carefully and test.
• Trendline slope over time: slope is computed using timestamps; small differences may make lines sensitive on very short timeframes — using bar_index differences is usually more stable.
• Not a true backtester: to evaluate performance statistically you must transform the logic into a strategy script that places hypothetical orders and records exact entry/exit prices.
________________________________________
14) Suggested improvements for advanced learners
• Record true entry price & timestamp for accurate PnL.
• Add position sizing: risk % per trade using SL distance and account size.
• Convert to strategy. (Pine Strategy)* to run formal backtests with equity curves, drawdowns, and metrics (Sharpe, Sortino).
• Log trades to an external spreadsheet (via alerts + webhook) for offline analysis.
• Add statistics: average win/loss, expectancy, max drawdown.
• Add additional filters: news time blackout, market session filters, multi-timeframe confirmation.
• Improve OB detection: combine wick/body, volume spike at base bar, and liquidity sweep detection.
________________________________________
15) Glossary — quick definitions
• ATR (Average True Range): measure of typical range; used to size targets and stops.
• EMA (Exponential Moving Average): trend smoothing giving more weight to recent prices.
• RSI (Relative Strength Index): momentum oscillator; >70 overbought, <30 oversold.
• MACD: momentum oscillator using difference of two EMAs.
• Bollinger Bands: volatility bands around SMA.
• Order Block: a base candle area with subsequent confirmation candles; a zone of institutional interest (learning model).
• Pivot High/Low: local turning point defined by candles on both sides.
• Signal Strength: combined score from multiple indicators.
• Win Rate: proportion of signals that hit TP vs total signals.
• R:R (Risk:Reward): ratio of potential reward (TP distance) to risk (entry to SL).
________________________________________
16) Limitations & assumptions (be explicit)
• This is an indicator for learning — not a trading robot or broker connection.
• No slippage, fees, commissions or tie-in to real orders are considered.
• The logic is heuristic (rule-of-thumb), not a guarantee of performance.
• Results are sensitive to timeframe, market liquidity, and parameter choices.
________________________________________
17) Practical classroom / study plan (4 sessions)
• Session 1 — Foundations: Understand EMAs, ATR, RSI, MACD, Bollinger Bands. Run the indicator and watch how these numbers change on a single day.
• Session 2 — Zones & Filters: Study order blocks and trendlines. Test volume & ATR filters and note changes in false signals.
• Session 3 — Simulated trading: Manually track 20 signals, compute real PnL and compare to the dashboard.
• Session 4 — Improvement plan: Propose changes (e.g., better PnL accounting, alternative OB rule) and test their impact.
________________________________________
18) Quick reference checklist for each signal
1. Was an order block or trendline break detected? (primary trigger)
2. Did volume meet threshold? (filter)
3. Did ATR filter (bar size) show a real move? (filter)
4. Was trend aligned (EMA 9/21/50)? (confirmation)
5. Signal confirmed → mark entry approximation, TP, SL.
6. Monitor dashboard (Signal Strength, Volatility, No-trade zone, R:R).
7. After exit, log real entry/exit, compute actual PnL, update spreadsheet.
________________________________________
19) Educational caveat & final note
This tool is built for training and analysis: it helps you see how common technical building blocks combine into trade ideas, but it is not a trading recommendation. Use it to develop judgment, to test hypotheses, and to design robust systems with proper backtesting and risk control before risking capital.
________________________________________
20) Disclaimer (must include)
Training & Educational Only — This material and the indicator are provided for educational purposes only. Nothing here is investment advice or a solicitation to buy or sell financial instruments. Past simulated or historical performance does not predict future results. Always perform full backtesting and risk management, and consider seeking advice from a qualified financial professional before trading with real capital.
________________________________________

Moon Scalper v3 + VSAMoon Scalper v3 is a high-precision scalping indicator optimized for the 15-minute chart. It delivers clean buy/sell signals with TP1 (1:1 risk-reward) exits using layered confirmations:
• **Volatility Bands** — SMA + multiplier detect expansion zones
• **EMA Filter (200)** — ensures trades align with trend
• **RSI Range Filter** — avoids extreme overbought/oversold traps (buy: 52–62, sell: 38–48)
• **Volume Spike Filter** — filters for institutional activity (vol > 1.4×SMA)
• **VSA Confirmation** — requires wide-spread, high-volume bars with reclaim (volume × 1.4, spread × 1.5, reclaim 50%)
**Usage Notes:**
Best used on 15m timeframe for liquid pairs (e.g., BTCUSDT, ETHUSDT). Signals appear as “BUY” / “SELL” labels on chart. Defaults yield high TP1 hit rate; use only during active sessions (e.g., London/NY) for best accuracy.
**Disclaimer:**
This indicator is for educational purposes only. Past performance is not a guarantee of future results. Always backtest before live trading and manage risk responsibly.
